
Introduction:
In the fast-paced arena of financial markets, understanding the nuances of technical analysis is like having a compass in the wilderness – it guides you, sharpens your instincts, and empowers you to navigate the complex terrain of stock trading with confidence.
In this blog post, we embark on a journey to delve deep into the realm of technical analysis. We’ve crafted a comprehensive guide tailored to both newcomers and experienced traders alike, with the aim of equipping you with the knowledge and tools needed to elevate your trading game.

Why Technical Analysis Matters:
But first, let’s answer a fundamental question: What exactly is technical analysis, and why is it so significant in the world of trading? Think of it as the art of decoding the language of stock charts. It involves analyzing historical price data and trading volumes to predict future price movements. This invaluable skill empowers traders to make informed decisions, identify potential trends, and optimize their trading strategies.
It’s worth noting that technical analysis differs significantly from fundamental analysis. While fundamental analysis looks at a company’s financial health and intrinsic value, technical analysis is all about deciphering the patterns and signals within price charts.
Unlocking the Toolbox:
Throughout this guide, we’ll explore the essential tools and indicators that every trader should have in their arsenal. From Moving Averages and the Relative Strength Index (RSI) to the intricate MACD, we’ll demystify these technical indicators and show you how to use them effectively in your trading endeavours.
Reading Between the Lines:
Additionally, we’ll delve into the fascinating world of chart patterns – from the classic head and shoulders to the intriguing triangles. Armed with knowledge, you’ll be able to recognize and interpret these patterns, unlocking a new dimension of understanding in your trading journey.
Candles and Actions:
Candlestick patterns, resembling a visual language of their own, will also take centre stage. We’ll explore the significance of bullish and bearish candlestick patterns, providing you with the tools to decipher market sentiment through the artful dance of candlesticks.
Support and Resilience:
Support and resistance levels, akin to the sturdy pillars of technical analysis, will be defined and explored. Discover how to identify these crucial levels and harness their power to make informed trading decisions, enhancing your risk management strategy along the way.
Mastering the Art:
Throughout this guide, we’ll emphasize the importance of disciplined risk management. After all, it’s not just about making profits; it’s about protecting what you’ve earned. We’ll provide invaluable tips on setting stop-loss orders and managing risk effectively in your trading endeavours.
Real-World Insight:
To bring these concepts to life, we’ll share real-world case studies and examples of successful trades driven by technical analysis. We’ll dissect charts, walk you through the decision-making process, and provide insights that bridge the gap between theory and practice.
A Journey, Not a Destination:
By the end of this comprehensive guide, you’ll have a solid foundation in technical analysis – a skill set that can propel you towards more informed trading decisions. However, remember that mastering technical analysis is a journey, not a destination. Stay patient, stay disciplined, and keep honing your skills. The path to becoming a successful trader is paved with continuous learning and practice.
Take the First Step:
Are you ready to unlock the power of technical analysis? Start your journey today by reading on. Apply what you learn, and watch as your trading acumen evolves. For more trading insights and updates, be sure to subscribe to our newsletter or follow our website. Your path to mastery begins here.
Now, let’s embark on this enlightening journey through the world of technical analysis.
Section 1: What is Technical Analysis?
At its core, technical analysis is the art of examining historical price and volume data to make educated predictions about future price movements. Imagine it as deciphering the hidden language of stock charts. By scrutinizing patterns and trends, technical analysts seek to unlock valuable insights that can guide their trading decisions.
Why Technical Analysis Matters
So, why should you care about technical analysis? Well, consider it your navigational compass in the world of trading. It empowers you to:
- Time Your Trades: Technical analysis helps you pinpoint optimal entry and exit points for stocks, allowing you to enter positions when the odds are in your favour.
- Manage Risk: By understanding potential price movements and setting stop-loss orders, you can mitigate losses and protect your capital.
- Identify Trends: Technical analysis can unveil emerging trends, enabling you to ride the wave of profitable opportunities.
- Fine-Tune Strategies: Whether you’re a day trader or a long-term investor, technical analysis provides you with versatile tools to tailor your approach to the market.
Contrasting Technical Analysis with Fundamental Analysis
Fundamental analysis is another fundamental aspect of stock trading. It’s important to differentiate between the two:
- Fundamental Analysis: Focuses on a company’s financial health, examining metrics like earnings, revenue, and market position.
- Technical Analysis: Zooms in on historical price data and trading volumes to predict future price movements.
While fundamental analysis is like studying a company’s report card, technical analysis is all about reading the market’s body language. Together, they form a comprehensive toolkit for any trader.
So, ready to dive deeper into the exciting world of technical analysis? Let’s move on to explore the essential tools and indicators that will enhance your trading prowess.
Section 2: Key Technical Analysis Tools and Indicators
In this section, we’ll introduce you to some of the most widely used technical instruments and explain how to wield them effectively.
1. Moving Averages: Unveiling Trends
Imagine having a crystal ball that reveals market trends. That’s essentially what moving averages provide. These lines on your charts smooth out price fluctuations, making it easier to identify trends. Here’s how they work:
- Simple Moving Average (SMA): This is a basic moving average that calculates the average price over a specified period. It’s great for identifying general trends and smoothing out short-term noise.
- Exponential Moving Average (EMA): EMA places more weight on recent prices, making it responsive to recent market shifts. It’s particularly useful for traders who want to capture short-term trends.
2. Relative Strength Index (RSI): Gauging Overbought and Oversold Conditions
Ever wished for a warning signal when a stock is about to reverse its course? RSI can provide just that. It’s a momentum oscillator that helps you identify overbought and oversold conditions. Here’s the gist:
- RSI values range from 0 to 100. Traditionally, a reading above 70 suggests that a stock may be overbought, while a reading below 30 indicates potential oversold conditions.
- By watching RSI, you can anticipate potential trend reversals or continuations, aiding your entry and exit decisions.
3. Moving Average Convergence Divergence (MACD): Unearthing Momentum
The MACD indicator is your trusty companion for understanding the momentum of a stock. It’s composed of two lines: the MACD line and the signal line. Here’s how to make sense of it:
- When the MACD line crosses above the signal line, it’s a bullish signal, suggesting that positive momentum is building.
- Conversely, when the MACD line crosses below the signal line, it’s a bearish signal, indicating potential downward momentum.
Practical Application
You might be wondering, “How do I use these indicators in the real world?” We’ll dive into practical examples and real-world scenarios in later sections, but for now, consider these tools as your allies in the quest for trading success.
In the next sections, we’ll delve deeper into chart patterns, candlestick patterns, support and resistance levels, and risk management strategies, providing you with a comprehensive toolkit to navigate the complexities of the stock market. So, stay tuned as we continue this exciting exploration into the world of technical analysis!
Section 3: Chart Patterns and Their Interpretation
In this section, we’ll explore common chart patterns that serve as roadmaps for traders seeking to anticipate future price movements. By the end, you’ll have the skills to recognize and interpret these patterns, providing you with a valuable edge in your trading endeavours.
Exploring Common Chart Patterns
Charts are not just a jumble of lines and data; they often reveal recurring patterns that signal potential changes in market sentiment. Let’s take a look at some of the most prevalent ones:
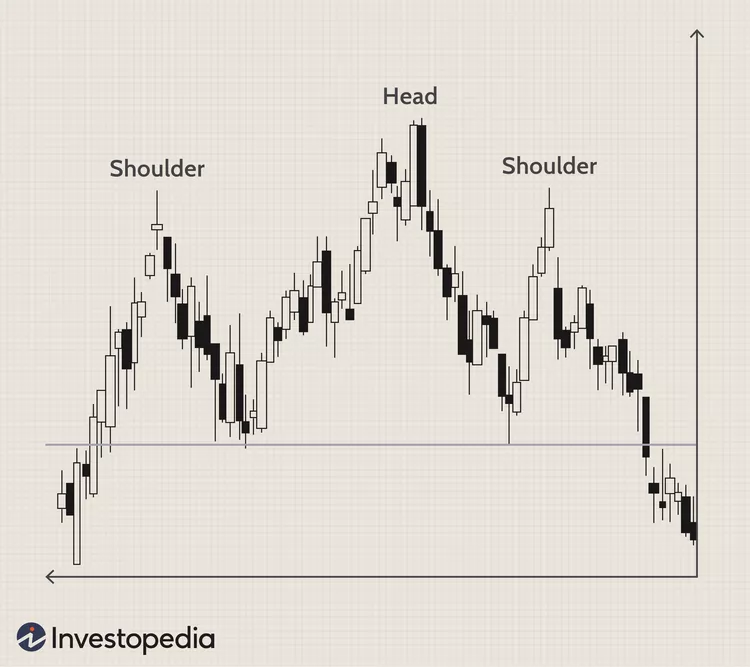
1. Head and Shoulders Pattern:
- Picture a head and shoulders in a stock chart. This pattern typically indicates a reversal from an uptrend to a downtrend.
- It consists of three peaks: a higher peak (the head) flanked by two lower peaks (the shoulders).
- When the neckline (a support level) is broken after the formation of this pattern, it can suggest a significant price decline.
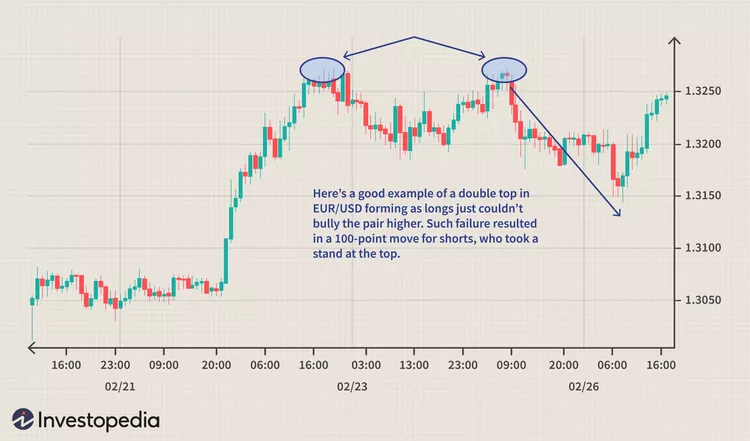
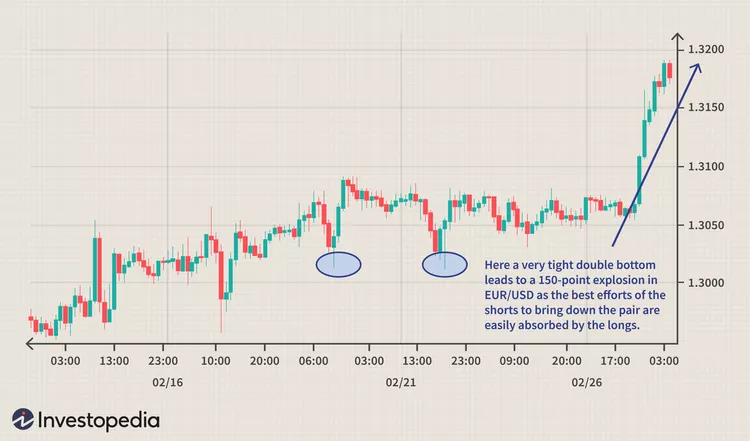
2. Double Tops and Bottoms:
- Double tops are two peaks at roughly the same price level, signalling a potential trend reversal from bullish to bearish.
- Double bottoms are two troughs at approximately the same price level, suggesting a shift from bearish to bullish sentiment.
- These patterns are often seen as battle zones between buyers and sellers.
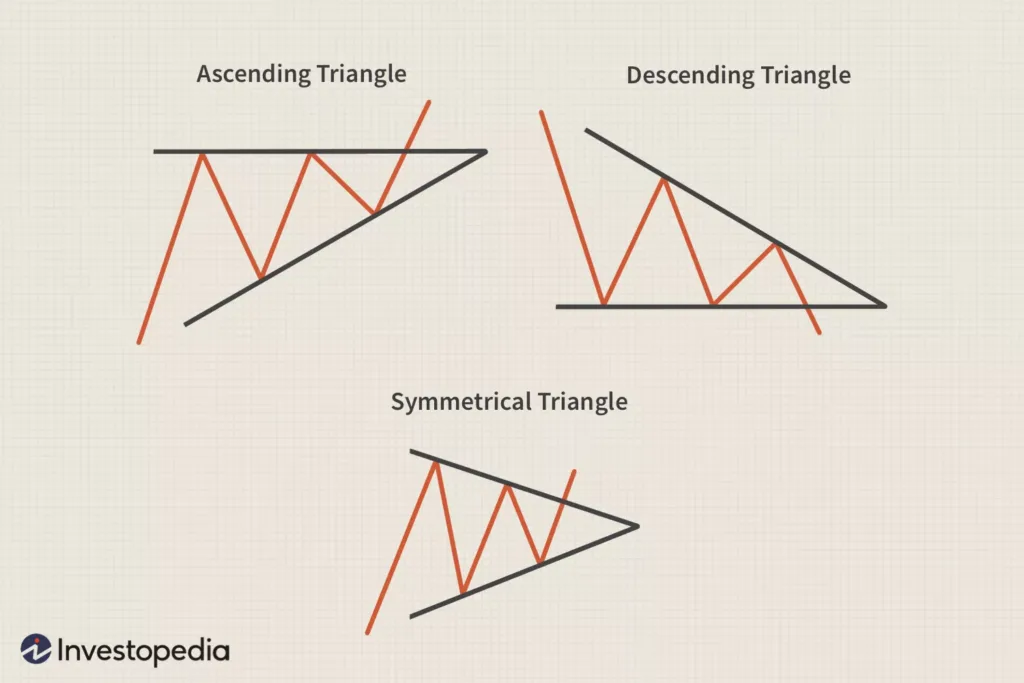
3. Triangles:
- Triangles come in various forms, including ascending, descending, and symmetrical.
- These patterns represent consolidation phases in the market, where price moves within a narrowing range.
- The breakout from a triangle pattern can signal the resumption of the previous trend.
Recognizing and Interpreting Patterns
Now that you know about these patterns, how do you use them effectively?
- Recognition: Begin by identifying these patterns on stock charts. This involves spotting the distinctive shapes and structures we discussed.
- Confirmation: Once a pattern is recognized, it’s crucial to wait for confirmation. This often involves the price breaking a key support or resistance level or following the expected pattern trajectory.
- Price Targets: Chart patterns can also provide clues about potential price targets after a breakout. Traders often use the height of the pattern as a guide.
- Volume Analysis: Consider the volume accompanying the pattern; it can lend credibility to the pattern’s significance.
As you become more adept at recognizing and interpreting chart patterns, you’ll be better equipped to make informed trading decisions. Keep in mind that practice and patience are essential to mastering this aspect of technical analysis.
In the next section, we’ll delve into another powerful tool in the technical analyst’s toolbox: candlestick patterns and price action. These visual cues provide additional insights into market sentiment, further enhancing your trading acumen. So, let’s continue our journey into the intricacies of technical analysis!
Section 4: Candlestick Patterns and Price Action
In this section, we’ll introduce you to candlestick patterns, which serve as windows into market sentiment, and explain how understanding price action can be a game-changer in your trading journey.
The Significance of Candlestick Patterns
Imagine each candlestick on your chart as a small story about the battle between buyers and sellers. These patterns, with their distinctive shapes and colours, offer valuable insights into market psychology. Here’s how to decode them:
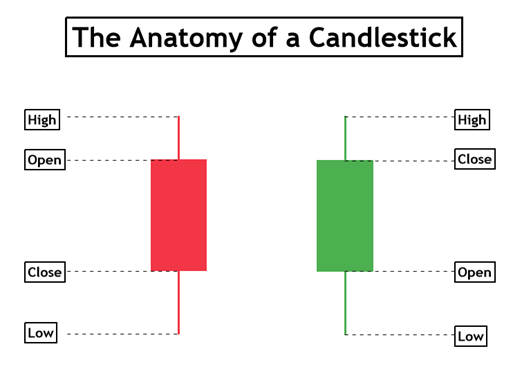
- Bullish and Bearish Candlesticks:
- A bullish candlestick, often green or white, signifies that the closing price is higher than the opening price. It suggests bullish sentiment and buying pressure.
- Conversely, a bearish candlestick, typically red or black, indicates that the closing price is lower than the opening price, hinting at bearish sentiment and selling pressure.
- Candlestick Patterns:
- There are numerous candlestick patterns, each with its own meaning. For instance, a “Doji” suggests indecision in the market, while a “Hammer” or “Shooting Star” can indicate potential reversals.
- These patterns can be standalone signals or serve as confirmation for other technical indicators and analysis methods.
Interpreting Price Action
Understanding price action means grasping the narrative that price movements tell. Here’s how price action analysis can enhance your trading:
- Support and Resistance Levels: As mentioned in earlier sections, these levels play a crucial role in price action. Traders often look for reactions at these levels to make informed decisions.
- Trend Analysis: Price action can confirm trends, showing you if a market is in an uptrend (higher highs and higher lows) or a downtrend (lower highs and lower lows).
- Reversal Patterns: By studying price action, you can spot potential reversal patterns like “Double Tops” and “Head and Shoulders,” aligning them with other indicators for greater confidence in your trading choices.
- Breakouts and Pullbacks: Recognizing breakouts from chart patterns and understanding pullbacks to key levels can provide ideal entry points and stop-loss placement.
Putting It All Together
Candlestick patterns and price action are like the body language of the market. They add depth and context to your technical analysis toolkit. When combined with other indicators and patterns we’ve discussed earlier, they empower you to make well-informed trading decisions.
As you continue your journey into mastering technical analysis, keep in mind that practice and observation are key. The more you immerse yourself in analyzing candlestick patterns and price action, the sharper your trading skills will become.
In our next section, we’ll explore the essential concepts of support and resistance levels. These price zones are the building blocks of technical analysis, and understanding them will further solidify your trading foundation. So, let’s proceed on this exciting learning journey!
Section 5: Support and Resistance Levels
In this section, we will explore the significance of these key price zones and how they can be harnessed as invaluable tools in your trading arsenal.
Defining Support and Resistance Levels
Imagine the stock market as a battlefield where bulls (buyers) and bears (sellers) wage constant warfare. Support and resistance levels are the battle lines, and understanding them is pivotal. Here’s a breakdown:
- Support Level:
- A support level is a price point where a stock or market historically finds buying interest, preventing it from falling further.
- Think of it as a safety net; when prices approach this level, buyers tend to step in, creating demand and potentially causing a price bounce.
- Resistance Level:
- On the flip side, a resistance level is where selling interest historically emerges, preventing prices from rising further.
- It’s like a ceiling; when prices reach this level, sellers become more active, generating supply and potentially causing a price pullback.
Importance of Support and Resistance Levels
These levels are the cornerstone of technical analysis for several reasons:
- Decision-Making Points: Traders use support and resistance levels to make critical decisions. For example, a trader might initiate a long (buy) position near a strong support level or sell short (bet on a price decline) near a robust resistance level.
- Risk Management: Setting stop-loss orders just below a support level or above a resistance level can help protect your capital if the market moves against your position.
- Trend Confirmation: Breakouts from key support or resistance levels can confirm the strength of a trend. A breakout above resistance might indicate an uptrend is gaining momentum, while a breakdown below support could signal a downtrend.
- Trading Ranges: In sideways or range-bound markets, support and resistance levels define the upper and lower bounds of price movement, providing clear boundaries for traders.
Identifying Support and Resistance Levels
Recognizing these levels on a price chart takes practice and observation. Here are some pointers:
- Historical Data: Start by analyzing historical price data to identify where price reversals have occurred in the past.
- Round Numbers: Psychological levels, often corresponding to round numbers (e.g., $100), can act as support or resistance.
- Trendlines: Draw trendlines connecting consecutive highs (resistance) or lows (support) to visualize these levels.
- Volume: High trading volumes at specific price points can indicate the significance of support or resistance.
Using Support and Resistance Levels in Your Trading
Incorporating these levels into your trading strategy involves:
- Entry Points: Consider entering positions near support levels in uptrends and resistance levels in downtrends.
- Stop-Loss Placement: Set stop-loss orders just below support (for long positions) or above resistance (for short positions) to manage risk.
- Take Profit Targets: When a trade is in your favour, consider taking profits near the next significant support (in uptrends) or resistance (in downtrends).
Remember, support and resistance levels are dynamic; they can shift over time. Regularly update your analysis to adapt to changing market conditions.
As you continue your journey in mastering technical analysis, these levels will become your trusted guides in navigating the ever-changing waters of the stock market. In the next section, we’ll explore risk management strategies, a crucial aspect of responsible trading.
Section 6: Risk Management Strategies in Technical Analysis
In this section, we’ll delve into the importance of risk management and provide you with valuable strategies to help safeguard your capital in the volatile world of trading.
Understanding the Significance of Risk Management
Picture risk management as the safety net beneath the tightrope walker. It’s the discipline of protecting your trading capital from significant losses. Here’s why it’s paramount:
- Preservation of Capital: Effective risk management ensures that even in turbulent markets, you have the resources to continue trading. It’s the key to longevity in this game.
- Emotional Control: Knowing you have a well-thought-out risk management plan in place can help keep emotions like fear and greed in check, leading to better decision-making.
- Consistency: Risk management helps you maintain a consistent trading approach, reducing the likelihood of catastrophic losses that can wipe out months of gains.
Key Risk Management Strategies
Now, let’s explore some tried-and-tested risk management strategies to incorporate into your trading routine:
- Position Sizing:
- Determine the size of each position based on a percentage of your total trading capital. A common rule of thumb is to risk no more than 1-2% of your capital on a single trade.
- Smaller position sizes reduce the impact of a losing trade on your overall portfolio.
- Setting Stop-Loss Orders:
- A stop-loss order is your safety valve. It’s a predetermined price at which you’ll exit a trade to limit potential losses.
- Place stop-loss orders based on technical analysis, such as below a support level for long positions or above a resistance level for short positions.
- Diversification:
- Avoid putting all your eggs in one basket. Diversify your trades across different assets or sectors to spread risk.
- A single losing trade won’t have a catastrophic impact on your portfolio when you diversify.
- Risk-Reward Ratio:
- Before entering a trade, consider the potential risk and reward. A common ratio is 1:2, meaning you aim to make twice as much as you’re risking.
- This ratio helps ensure that winning trades can offset losses over time.
- Trading Psychology:
- Keep emotions in check. Fear and greed can lead to impulsive decisions and risk mismanagement.
- Stick to your predefined risk management plan, regardless of emotional impulses.
Adapting Risk Management to Technical Analysis
As a technical analyst, you can integrate risk management seamlessly into your trading approach:
- Use technical indicators and chart patterns to identify potential entry and exit points while considering the associated risk.
- Calculate position sizes based on support and resistance levels, adjusting your risk percentage accordingly.
- Continuously monitor and adjust your stop-loss orders as price levels evolve, safeguarding your profits and limiting losses.
By consistently applying these risk management strategies in conjunction with your technical analysis, you’ll not only enhance your trading discipline but also increase your odds of long-term success.
In the final section of this comprehensive guide, we’ll tie everything together, sharing real-world case studies and examples of successful trades that leverage the principles of technical analysis and risk management.
Section 7: Case Studies and Examples
In this section, we’ll walk you through some hypothetical case studies and examples of successful trades, applying the principles and strategies we’ve explored throughout this comprehensive guide.
Case Study 1: Riding the Trend with Moving Averages
Let’s start with a classic example of how technical analysis tools can help you ride a trend. Imagine you’re interested in trading a popular tech stock, and you’ve been eyeing its 50-day Simple Moving Average (SMA).
- Entry Point: You notice that the stock has been consistently trading above its 50-day SMA, indicating an uptrend. This moving average serves as your entry signal.
- Risk Management: To protect your capital, you set a stop-loss order just below the 50-day SMA, ensuring that even if the trend reverses, your losses are limited.
- Exit Strategy: You decide to exit the trade when the stock breaks below the 50-day SMA, signalling a potential trend reversal.
This case study illustrates how moving averages can guide your entry and exit decisions in a trending market.
Case Study 2: Capitalizing on Chart Patterns
Now, let’s explore the power of chart patterns. Consider a scenario where you’re analyzing the chart of a commodity like gold and spot a classic “Double Bottom” pattern.
- Recognition: You identify two significant lows at roughly the same price level, forming the characteristic “W” shape of a double bottom.
- Confirmation: To confirm the pattern, you wait for a breakout above the pattern’s neckline. Once this occurs, it validates the pattern and signals a potential bullish reversal.
- Risk Management: To manage risk, you set a stop-loss order just below the pattern’s second bottom, protecting your trade in case of a false breakout.
- Profit Target: You calculate a profit target by measuring the distance between the pattern’s bottom and neckline, which can provide an estimate of the potential price move after the breakout.
This case study demonstrates how recognizing and trading chart patterns can be a valuable strategy for anticipating trend reversals.
Case Study 3: Applying Risk Management in a Volatile Market
Imagine you’re trading a highly volatile cryptocurrency, known for its price swings. This case study emphasizes the importance of sound risk management in such markets.
- Position Sizing: Given the asset’s volatility, you decide to allocate only a small percentage of your trading capital to this trade.
- Setting a Wide Stop-Loss: To account for the asset’s volatility, you set a wider stop-loss order, allowing room for price fluctuations without getting prematurely stopped out.
- Risk-Reward Ratio: You ensure that the potential reward justifies the risk, aiming for a favourable risk-reward ratio.
- Emotional Discipline: Despite the market’s wild swings, you stick to your predefined risk management plan, avoiding impulsive decisions driven by fear or greed.
These case studies showcase how technical analysis and risk management work hand in hand to improve your trading performance and minimize potential losses.
Conclusion: Mastery Takes Practice
As you’ve journeyed through this comprehensive guide, you’ve gained a solid foundation in technical analysis and risk management. Remember that mastering these skills takes practice and discipline. Stay committed to refining your trading approach, continuously adapt to market conditions, and never stop learning.
By applying the principles and strategies outlined in this guide, you’re well-equipped to make more informed trading decisions, manage risk effectively, and, ultimately, increase your chances of success in the dynamic world of stock trading.
Call to Action
Now that you’ve armed yourself with these essential tools and knowledge, it’s time to put them into action. Apply what you’ve learned in your trading activities, and don’t hesitate to seek further education and guidance as you continue your trading journey. Stay informed, stay disciplined, and may your trading endeavours be prosperous and rewarding.